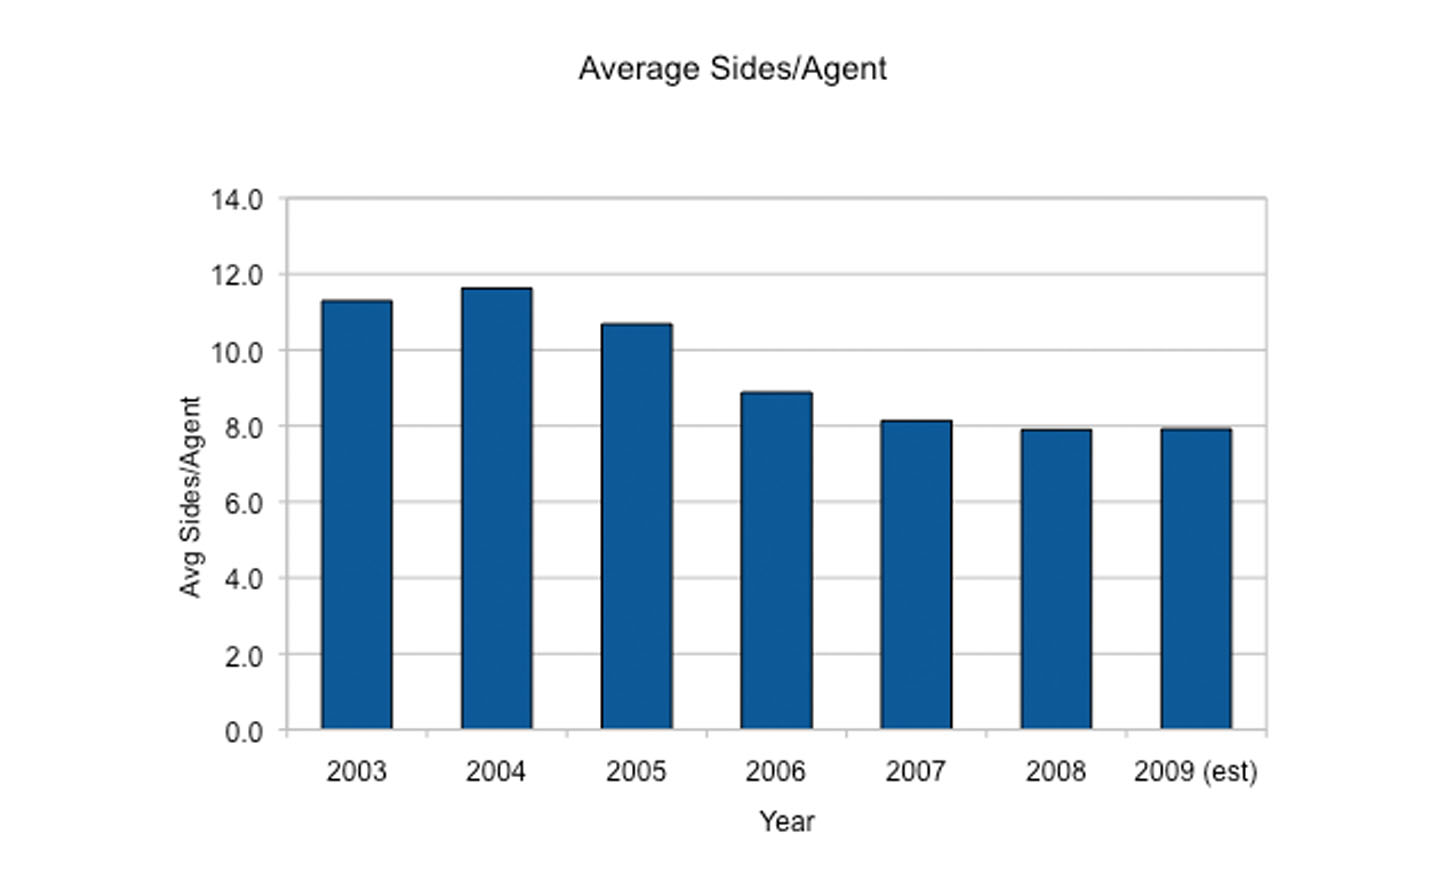
Inspired by a recent post on Rain City Guide called The Third Bubble by Chuck Reilling, we ran some numbers across our 100 or so MLSs from across the country and came up with the following sides per agent trend graph:

Unlike Chuck’s graphs, this graph shows a significant flattening over the last two and a half years. I’m interpreting that as indicating the amount of membership decline still in the pipeline may be pretty low. Or is that just me being too optimistic? What do you think?
 Michael Wurzer